Human Spondin-1(SPON1) ELISA kit CSB-EL022599HU CUSABIO
$50.00
In stock
SKU
CSB-EL022599HU
Product Details
| Target Name | spondin 1, extracellular matrix protein |
| Uniprot No. | Q9HCB6 |
| Species | Homo sapiens (Human) |
| Storage | Store at 2-8°C. Please refer to protocol. |
| Sensitivity | 0.039 ng/mL |
| Troubleshooting and FAQs | ELISA kit FAQs |
| Lead Time | 3-5 working days after you place the order, and it takes another 3-5 days for delivery via DHL or FedEx. |
| Associated names | SPON1 ELISA kit; KIAA0762 ELISA kit; VSGPSpondin-1 ELISA kit; F-spondin ELISA kit; Vascular smooth muscle cell growth-promoting factor ELISA kit |
| Abbreviation | SPON1 |
| Sample Types | serum, plasma, tissue homogenates |
| Detection Range | 0.156 ng/mL-10 ng/mL |
| Assay Time | 1-5h |
| Sample Loading Volume | 50-100ul |
| Detection Wavelength | 450 nm |
| Research Area | Neuroscience |
| Assay Principle | quantitative |
| Measurement | Sandwich |
| Precision | headers: Intra-assay Precision (Precision within an assay): CV%<8%; rows: Intra-assay Precision (Precision within an assay): CV%<8%: Intra-assay Precision (Precision within an assay): CV%<8%; 1: Three samples of known concentration were tested twenty times on one plate to assess.; Intra-assay Precision (Precision within an assay): CV%<8%: Inter-assay Precision (Precision between assays): CV%<10%; 1: Three samples of known concentration were tested in twenty assays to assess.; |
| Linearity | headers: To assess the linearity of the assay, samples were spiked with high concentrations of human spondin-1 in various matrices and diluted with the Sample Diluent to produce samples with values within the dynamic range of the assay.; rows: To assess the linearity of the assay, samples were spiked with high concentrations of human spondin-1 in various matrices and diluted with the Sample Diluent to produce samples with values within the dynamic range of the assay.: To assess the linearity of the assay, samples were spiked with high concentrations of human spondin-1 in various matrices and diluted with the Sample Diluent to produce samples with values within the dynamic range of the assay.; 2: Sample; 3: Serum(n=4); 1: 1:1; 2: Average %; 3: 84; 1: Range %; 2: 80-91; 1: 1:2; 2: Average %; 3: 86; 1: Range %; 2: 81-92; 1: 1:4; 2: Average %; 3: 92; 1: Range %; 2: 87-100; 1: 1:8; 2: Average %; 3: 95; 1: Range %; 2: 88-101 |
| Recovery | headers: The recovery of human spondin-1 spiked to levels throughout the range of the assay in various matrices was evaluated. Samples were diluted prior to assay as directed in the Sample Preparation section.; rows: The recovery of human spondin-1 spiked to levels throughout the range of the assay in various matrices was evaluated. Samples were diluted prior to assay as directed in the Sample Preparation section.: The recovery of human spondin-1 spiked to levels throughout the range of the assay in various matrices was evaluated. Samples were diluted prior to assay as directed in the Sample Preparation section.; 1: Sample Type; 2: Average % Recovery; 3: Range; 1: Serum (n=5); 2: 97; 3: 90-104; 1: EDTA plasma (n=4); 2: 93; 3: 86-97; ; |
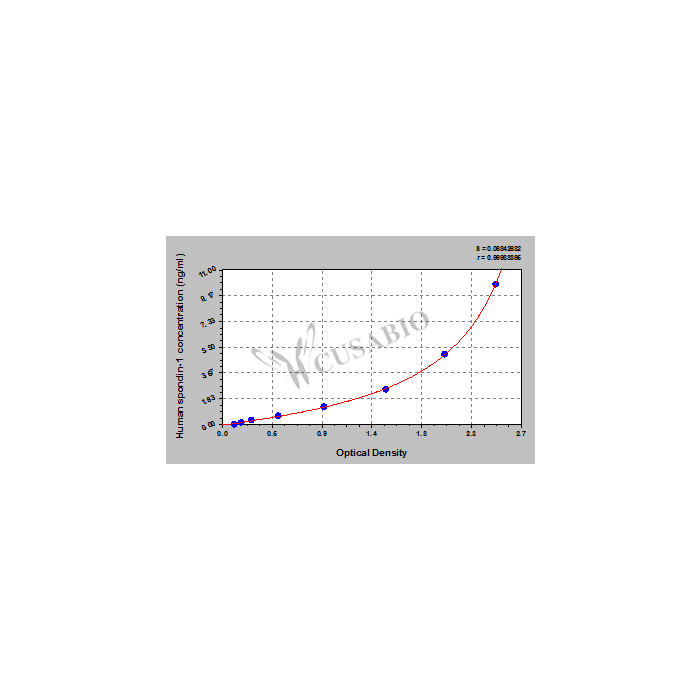
| Typical Data | headers: These standard curves are provided for demonstration only. A standard curve should be generated for each set of samples assayed.; rows: These standard curves are provided for demonstration only. A standard curve should be generated for each set of samples assayed.: These standard curves are provided for demonstration only. A standard curve should be generated for each set of samples assayed.; 1: ng/ml OD1 OD2 Average Corrected 10 2.504 2.463 2.484 2.365 5 2.006 2.042 2.024 1.905 2.5 1.506 1.479 1.493 1.374 1.25 0.973 0.897 0.935 0.816 0.625 0.511 0.518 0.515 0.396 0.312 0.285 0.268 0.276 0.157 0.156 0.176 0.187 0.182 0.063 0 0.121 0.117 0.119; 2: ng/ml; 3: OD1; 4: OD2; 5: Average; 6: Corrected; 8: 10; 9: 2.504; 10: 2.463; 11: 2.484; 12: 2.365; 14: 5; 15: 2.006; 16: 2.042; 17: 2.024; 18: 1.905; 20: 2.5; 21: 1.506; 22: 1.479; 23: 1.493; 24: 1.374; 26: 1.25; 27: 0.973; 28: 0.897; 29: 0.935; 30: 0.816; 32: 0.625; 33: 0.511; 34: 0.518; 35: 0.515; 36: 0.396; 38: 0.312; 39: 0.285; 40: 0.268; 41: 0.276; 42: 0.157; 44: 0.156; 45: 0.176; 46: 0.187; 47: 0.182; 48: 0.063; 50: 0; 51: 0.121; 52: 0.117; 53: 0.119; 1: ng/ml; 2: OD1; 3: OD2; 4: Average; 5: Corrected; 1: 10; 2: 2.504; 3: 2.463; 4: 2.484; 5: 2.365; 1: 5; 2: 2.006; 3: 2.042; 4: 2.024; 5: 1.905; 1: 2.5; 2: 1.506; 3: 1.479; 4: 1.493; 5: 1.374; 1: 1.25; 2: 0.973; 3: 0.897; 4: 0.935; 5: 0.816; 1: 0.625; 2: 0.511; 3: 0.518; 4: 0.515; 5: 0.396; 1: 0.312; 2: 0.285; 3: 0.268; 4: 0.276; 5: 0.157; 1: 0.156; 2: 0.176; 3: 0.187; 4: 0.182; 5: 0.063; 1: 0; 2: 0.121; 3: 0.117; 4: 0.119 |
| ELISA Data Analysis | ELISA Standard Curve & Curve Expert software |
| Shelf Life | 6 months |
| Description | This human spondin-1 (SPON1) ELISA kit employs the quantitative sandwich enzyme immunoassay technique to measure the levels of human SPON1 in multiple samples, including serum, plasma, or tissue homogenates. It also uses the enzyme-substrate chromogenic reaction to visualize and analyze the analyte levels through the color intensity. The intensity of the colored product is in direct proportion to the SPON1 levels in the sample and is measured at 450 nm through a microplate reader. SPON1 is an extracellular matrix protein that is derived from the floor plate of vertebrate embryos and is involved in the growth of axons during embryonic development, differentiation of neural cells, and the promotion of axonal regeneration post-injury. SPON1 could bind the amyloid precursor protein and inhibit its cleavage by β-secretase, leading to cognitive decline in Alzheimer's disease. Aberrant expression of SPON1 has been found in solid tumors. SPON1 has been reported to promote tumor invasion and metastasis in liver cancer. |
MDSD