Rat tight junction protein 1 (ZO1) ELISA Kit CSB-E17287r CUSABIO
$50.00
In stock
SKU
CSB-E17287r
Product Details
| Target Name | tight junction protein 1 (ZO1) |
| Species | Rattus norvegicus (Rat) |
| Storage | Store at 2-8°C. Please refer to protocol. |
| Sensitivity | 7.8 pg/mL |
| Troubleshooting and FAQs | ELISA kit FAQs |
| Lead Time | 3-5 working days after you place the order, and it takes another 3-5 days for delivery via DHL or FedEx. |
| Associated names | DKFZp686M05161, MGC133289, ZO-1, tight junction protein 1|tight junction protein ZO-1|zona occludens 1|zonula occludens 1 protein |
| Abbreviation | ZO1 |
| Sample Types | serum, plasma, tissue homogenates, cell lysates |
| Detection Range | 31.25 pg/mL-2000 pg/mL |
| Assay Time | 1-5h |
| Sample Loading Volume | 50-100ul |
| Detection Wavelength | 450 nm |
| Research Area | Tags & Cell Markers |
| Assay Principle | quantitative |
| Measurement | Sandwich |
| Precision | headers: Intra-assay Precision (Precision within an assay): CV%<8%; rows: Intra-assay Precision (Precision within an assay): CV%<8%: Intra-assay Precision (Precision within an assay): CV%<8%; 1: Three samples of known concentration were tested twenty times on one plate to assess.; Intra-assay Precision (Precision within an assay): CV%<8%: Inter-assay Precision (Precision between assays): CV%<10%; 1: Three samples of known concentration were tested in twenty assays to assess.; |
| Linearity | headers: To assess the linearity of the assay, samples were spiked with high concentrations of rat ZO1 in various matrices and diluted with the Sample Diluent to produce samples with values within the dynamic range of the assay.; rows: To assess the linearity of the assay, samples were spiked with high concentrations of rat ZO1 in various matrices and diluted with the Sample Diluent to produce samples with values within the dynamic range of the assay.: To assess the linearity of the assay, samples were spiked with high concentrations of rat ZO1 in various matrices and diluted with the Sample Diluent to produce samples with values within the dynamic range of the assay.; 2: Sample; 3: Serum(n=4); 1: 1:1; 2: Average %; 3: 91; 1: Range %; 2: 86-95; 1: 1:2; 2: Average %; 3: 102; 1: Range %; 2: 97-107; 1: 1:4; 2: Average %; 3: 91; 1: Range %; 2: 85-97; 1: 1:8; 2: Average %; 3: 97; 1: Range %; 2: 91-103 |
| Recovery | headers: The recovery of rat ZO1 spiked to levels throughout the range of the assay in various matrices was evaluated. Samples were diluted prior to assay as directed in the Sample Preparation section.; rows: The recovery of rat ZO1 spiked to levels throughout the range of the assay in various matrices was evaluated. Samples were diluted prior to assay as directed in the Sample Preparation section.: The recovery of rat ZO1 spiked to levels throughout the range of the assay in various matrices was evaluated. Samples were diluted prior to assay as directed in the Sample Preparation section.; 1: Sample Type; 2: Average % Recovery; 3: Range; 1: Serum (n=5); 2: 95; 3: 89-98; 1: EDTA plasma (n=4); 2: 97; 3: 90-100; ; |
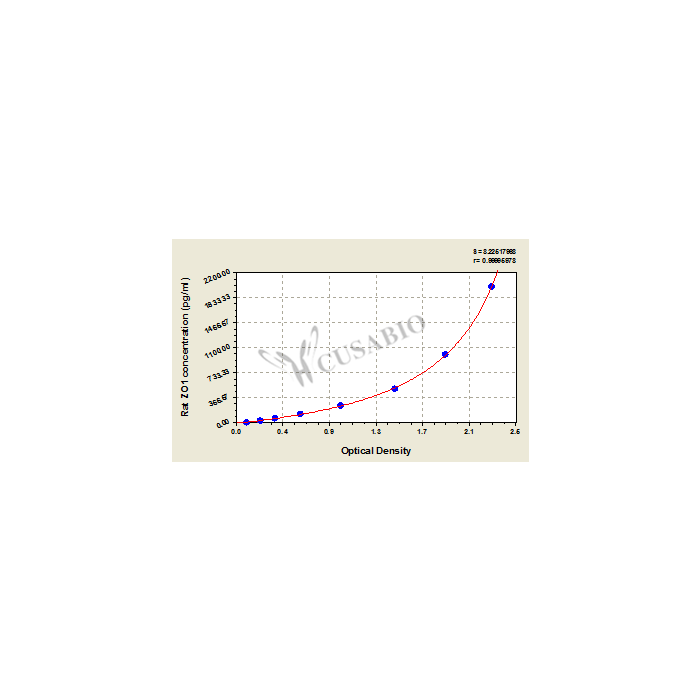
| Typical Data | headers: These standard curves are provided for demonstration only. A standard curve should be generated for each set of samples assayed.; rows: These standard curves are provided for demonstration only. A standard curve should be generated for each set of samples assayed.: These standard curves are provided for demonstration only. A standard curve should be generated for each set of samples assayed.; 1: pg/ml OD1 OD2 Average Corrected 2000 2.272 2.374 2.323 2.221 1000 1.846 1.967 1.907 1.805 500 1.496 1.392 1.444 1.342 250 0.962 0.946 0.954 0.852 125 0.578 0.596 0.587 0.485 62.5 0.364 0.351 0.358 0.256 31.2 0.225 0.230 0.228 0.126 0 0.101 0.102 0.102; 2: pg/ml; 3: OD1; 4: OD2; 5: Average; 6: Corrected; 8: 2000; 9: 2.272; 10: 2.374; 11: 2.323; 12: 2.221; 14: 1000; 15: 1.846; 16: 1.967; 17: 1.907; 18: 1.805; 20: 500; 21: 1.496; 22: 1.392; 23: 1.444; 24: 1.342; 26: 250; 27: 0.962; 28: 0.946; 29: 0.954; 30: 0.852; 32: 125; 33: 0.578; 34: 0.596; 35: 0.587; 36: 0.485; 38: 62.5; 39: 0.364; 40: 0.351; 41: 0.358; 42: 0.256; 44: 31.2; 45: 0.225; 46: 0.230; 47: 0.228; 48: 0.126; 50: 0; 51: 0.101; 52: 0.102; 53: 0.102; 1: pg/ml; 2: OD1; 3: OD2; 4: Average; 5: Corrected; 1: 2000; 2: 2.272; 3: 2.374; 4: 2.323; 5: 2.221; 1: 1000; 2: 1.846; 3: 1.967; 4: 1.907; 5: 1.805; 1: 500; 2: 1.496; 3: 1.392; 4: 1.444; 5: 1.342; 1: 250; 2: 0.962; 3: 0.946; 4: 0.954; 5: 0.852; 1: 125; 2: 0.578; 3: 0.596; 4: 0.587; 5: 0.485; 1: 62.5; 2: 0.364; 3: 0.351; 4: 0.358; 5: 0.256; 1: 31.2; 2: 0.225; 3: 0.230; 4: 0.228; 5: 0.126; 1: 0; 2: 0.101; 3: 0.102; 4: 0.102 |
| ELISA Data Analysis | ELISA Standard Curve & Curve Expert software |
| Shelf Life | 6 months |
| Description | Tight junction protein 1 (ZO1) is a scaffolding protein that localizes to tight junctions in epithelial and endothelial cells. This cytoplasmic protein maintains cell-cell adhesion, regulates paracellular permeability, and organizes the tight junction complex by linking transmembrane proteins to the actin cytoskeleton. ZO1 is widely studied in research examining barrier function, epithelial integrity, and various pathological conditions including inflammation, cancer metastasis, and tissue remodeling processes. The Rat tight junction protein 1 (ZO1) ELISA Kit (CSB-E17287r) is designed for quantitative measurement of ZO1 in Rattus norvegicus samples. This sandwich ELISA accommodates serum, plasma, tissue homogenates, and cell lysates with a detection range of 31.25 pg/mL to 2000 pg/mL and sensitivity of 7.8 pg/mL. The assay requires 50-100 μL sample volume, measures absorbance at 450 nm, and can be completed within 1-5 hours. Application Examples Note: The following application examples are drawn from a selection of publications citing this product. For additional applications, please refer to the full list of references in the "Citations" section. This ELISA kit has been used in research examining tight junction integrity and barrier function in various tissue types. Studies have applied the kit to quantify tight junction protein levels in tissue homogenates as part of biomarker panels examining cellular barrier dysfunction and inflammatory responses. • Urological research: Measurement of tight junction protein levels in urothelium tissue as part of multi-biomarker panels examining bladder dysfunction and inflammatory processes • Gastrointestinal barrier studies: Quantification of tight junction proteins in colon tissue homogenates to evaluate intestinal barrier integrity alongside other junction proteins • Tissue barrier function: Analysis of tight junction protein expression in tissue samples to understand cellular barrier maintenance and dysfunction in disease models • Multi-biomarker profiling: Integration with biomarker panels examining inflammatory mediators, oxidative stress markers, and barrier function proteins in tissue-based studies |
MDSD