Human Legumain(LGMN) ELISA kit CSB-EL012903HU CUSABIO
$50.00
In stock
SKU
CSB-EL012903HU
Product Details
| Uniprot No. | Q99538 |
| Species | Homo sapiens (Human) |
| Storage | Store at 2-8°C. Please refer to protocol. |
| Sensitivity | 15.6 pg/mL |
| Troubleshooting and FAQs | ELISA kit FAQs |
| Lead Time | 3-5 working days after you place the order, and it takes another 3-5 days for delivery via DHL or FedEx. |
| Associated names | AEP ELISA Kit; Asparaginyl endopeptidase ELISA Kit; cysteine 1 ELISA Kit; Cysteine protease 1 ELISA Kit; EC 3.4.22.34 ELISA Kit; Legumain ELISA Kit; LGMN ELISA Kit; LGMN_HUMAN ELISA Kit; LGMN1 ELISA Kit; Protease ELISA Kit; Protease cysteine 1 (legumain) ELISA Kit; Protease cysteine 1 ELISA Kit; PRSC1 ELISA Kit |
| Abbreviation | LGMN |
| Sample Types | serum, plasma, tissue homogenates |
| Detection Range | 62.5 pg/mL-4000 pg/mL |
| Assay Time | 1-5h |
| Sample Loading Volume | 50-100ul |
| Detection Wavelength | 450 nm |
| Research Area | Cancer |
| Assay Principle | quantitative |
| Measurement | Sandwich |
| Precision | headers: Intra-assay Precision (Precision within an assay): CV%<8%; rows: Intra-assay Precision (Precision within an assay): CV%<8%: Intra-assay Precision (Precision within an assay): CV%<8%; 1: Three samples of known concentration were tested twenty times on one plate to assess.; Intra-assay Precision (Precision within an assay): CV%<8%: Inter-assay Precision (Precision between assays): CV%<10%; 1: Three samples of known concentration were tested in twenty assays to assess.; 1: Intra-Assay Precision Inter-Assay Precision Sample 1 2 3 1 2 3 n 20 20 20 20 20 20 Mean(pg/ml) 517.073 505.781 486.170 497.353 507.189 517.073 SD 0.030 0.032 0.026 0.038 0.035 0.051 CV(%) 5.217 5.644 4.702 6.774 6.162 8.870; 3: Intra-Assay Precision; 4: Inter-Assay Precision; 5: Sample; 6: 1; 7: 2; 8: 3; 9: 1; 10: 2; 11: 3; 12: n; 13: 20; 14: 20; 15: 20; 16: 20; 17: 20; 18: 20; 19: Mean(pg/ml); 20: 517.073; 21: 505.781; 22: 486.170; 23: 497.353; 24: 507.189; 25: 517.073; 26: SD; 27: 0.030; 28: 0.032; 29: 0.026; 30: 0.038; 31: 0.035; 32: 0.051; 33: CV(%); 34: 5.217; 35: 5.644; 36: 4.702; 37: 6.774; 38: 6.162; 39: 8.870; 2: Intra-Assay Precision; 3: Inter-Assay Precision; 1: Sample; 2: 1; 3: 2; 4: 3; 5: 1; 6: 2; 7: 3; 1: n; 2: 20; 3: 20; 4: 20; 5: 20; 6: 20; 7: 20; 1: Mean(pg/ml); 2: 517.073; 3: 505.781; 4: 486.170; 5: 497.353; 6: 507.189; 7: 517.073; 1: SD; 2: 0.030; 3: 0.032; 4: 0.026; 5: 0.038; 6: 0.035; 7: 0.051; 1: CV(%); 2: 5.217; 3: 5.644; 4: 4.702; 5: 6.774; 6: 6.162; 7: 8.870; |
| Linearity | headers: To assess the linearity of the assay, samples were spiked with high concentrations of human LGMN in various matrices and diluted with the Sample Diluent to produce samples with values within the dynamic range of the assay.; rows: To assess the linearity of the assay, samples were spiked with high concentrations of human LGMN in various matrices and diluted with the Sample Diluent to produce samples with values within the dynamic range of the assay.: To assess the linearity of the assay, samples were spiked with high concentrations of human LGMN in various matrices and diluted with the Sample Diluent to produce samples with values within the dynamic range of the assay.; 2: Sample; 3: Serum(n=4); 1: 1:2; 2: Average %; 3: 93; 1: Range %; 2: 85-102; 1: 1:4; 2: Average %; 3: 90; 1: Range %; 2: 84-100; 1: 1:8; 2: Average %; 3: 95; 1: Range %; 2: 85-102; 1: 1:16; 2: Average %; 3: 95; 1: Range %; 2: 89-102; |
| Recovery | headers: The recovery of human LGMN spiked to levels throughout the range of the assay in various matrices was evaluated. Samples were diluted prior to assay as directed in the Sample Preparation section.; rows: The recovery of human LGMN spiked to levels throughout the range of the assay in various matrices was evaluated. Samples were diluted prior to assay as directed in the Sample Preparation section.: The recovery of human LGMN spiked to levels throughout the range of the assay in various matrices was evaluated. Samples were diluted prior to assay as directed in the Sample Preparation section.; 1: Sample Type; 2: Average % Recovery; 3: Range%; 1: Serum (n=5); 2: 96; 3: 84-105; 1: EDTA plasma (n=4); 2: 97; 3: 81-105; |
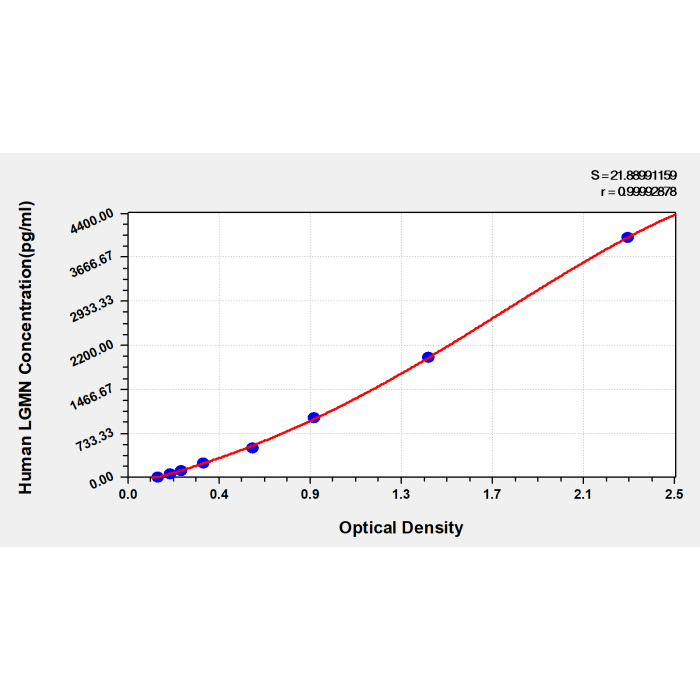
| Typical Data | headers: These standard curves are provided for demonstration only. A standard curve should be generated for each set of samples assayed.; rows: These standard curves are provided for demonstration only. A standard curve should be generated for each set of samples assayed.: These standard curves are provided for demonstration only. A standard curve should be generated for each set of samples assayed.; ; 1: pg/ml; 2: OD1; 3: OD2; 4: Average; 5: Corrected; 1: 4000; 2: 2.300; 3: 2.312; 4: 2.306; 5: 2.155; 1: 2000; 2: 1.395; 3: 1.395; 4: 1.395; 5: 1.244; 1: 1000; 2: 0.886; 3: 0.855; 4: 0.870; 5: 0.719; 1: 500; 2: 0.581; 3: 0.593; 4: 0.587; 5: 0.436; 1: 250; 2: 0.369; 3: 0.351; 4: 0.360; 5: 0.209; 1: 125; 2: 0.260; 3: 0.262; 4: 0.261; 5: 0.110; 1: 62.5; 2: 0.205; 3: 0.216; 4: 0.211; 5: 0.060; 1: 0; 2: 0.154; 3: 0.148; 4: 0.151; |
| ELISA Data Analysis | ELISA Standard Curve & Curve Expert software |
| Shelf Life | 6 months |